
![]()
![]()
![]()
![]()
In our laboratory we primarily use two
different spectroscopic methods to study Hb S fiber formation:
Kinetic Turbidity measurements and
UV resonance Raman
(UVRR) Spectroscopy.
In the turbidity experiment, the
measurement is performed as a function of time in order to gain
information regarding the rate of protein association.
This is particularly important in the case of sickle cell disease -
if fiber formation can be delayed long enough then the Hb molecules will
become re-oxygenated and the probability of forming the fibers is
greatly reduce
(links to fiber formation page –Hb S needs to be deoxy to form fibers).
This technique is particularly useful for establishing the
conditions under which the fibers can be formed and assessing the
effectiveness of different inhibitors.
How do we do
it?
In this experiment (FIG
7.1) the absorbance of
the solution is measured at 700 nm. At this wavelength, which is at the limit of our visual
range, the hemoglobin solution itself has very little absorbance.
As a function of time, the absorbance at this wavelength (A700)
increases, because of the fiber formation.
The size of the fibers leads to scattering of the light.
As the fibers get bigger, more light is scattered rather than going
through the solution, leading to an apparent increase in absorption.
Since this process is proportional to the size and amount of fibers
formed, we can use the plots of A700 vs. time to determine the rate of
fiber formation. The delay
time is taken as the point at which 50% of the fibers have formed.
In the figure, it can be seen that the delay time is exponentially
proportional to the concentration of hemoglobin molecules.
Higher and higher concentrations of hemoglobin lead to faster delay
times.
|
|
Yohe et al. (2000) Biophys. J., 78, in press |
•FIG
7.2 Double
nucleation mechanism
image taken from http://k12education.uams.edu |
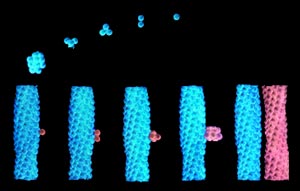
We can interpret the curves in terms
of the double nucleation model (FIG 7.2). The initial flat portion of the curve corresponds to the time
required for homogenous nucleation or the time that is required to form
the critical nucleus. Up
until this point, it is energetically unfavorable to bring the Hb
molecules together. After the
critical nucleus is formed, the association of molecules is more favorable
and the fibers can start building on themselves.
This process, called heterogeneous nucleation, occurs very rapidly
and corresponds to the steeply rising region of the curve.
UV resonance Raman Spectroscopy
The other main spectroscopic method
that we use to study the fibers is UV resonance Raman spectroscopy (UVRR).
This technique examines molecules at an atomic level through their
vibrational motion. Spectra
of the fibers are obtained and then compared with spectra of individual or
unassociated Hb S tetramers. Any
differences between the two spectra are attributed to structural changes
caused by the formation of the fibers.
Previous
| Next
(What is Raman Spectroscopy?)