Topics:
-What
do we measure with UVRR?
-What
did UVRR tell us about Hb A and Hb S tetramers
-How
do Hb S fibers compare with Hb S tetramers?
-Other
structural changes observed
Previously,
we have used Ultraviolet Resonance Raman (UVRR) spectroscopy to look at individual Hb S molecules and Hb
S fibers. Hemoglobin, itself,
has been well characterized using UVRR spectroscopy by the Spiro
and Friedman
labs. These
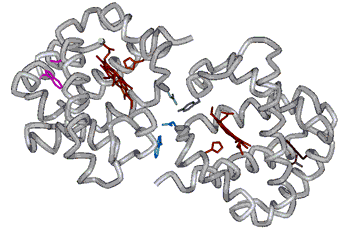
labs have demonstrated that important hydrogen (H)-bonds formed across the
a1b2 interface that stabilize the T- or deoxy state are
observable by UVRR spectroscopy.
These
important H-bonds are formed between the b37 Trp and
a94 Asp residues and the
a42 Tyr and
b99 Asp residues
(FIG
9.1).
In the UVRR spectrum, we observe signals associated with Trp and
Tyr that either increase in intensity or shift in frequency because of
H-bond formation.
What
did UVRR tell us about Hb A and Hb S tetramers
Our
initial studies with UVRR spectroscopy
(link
to pdf of published paper 105 kb) showed that the H-bonds formed in Hb S were the
same as those formed in Hb A. (FIG
9.2) From this we could conclude that the overall structure or the quaternary
structure of Hb S in the T-state was the same as Hb A.
However, the UVRR spectra also indicated that there were subtle
differences between the two proteins.
In particular, these spectra demonstrated that the environment of
Trp residues in Hb S were slightly different from those in Hb A.
Specifically, from the frequency of the peak we could determine
that either the a14
or b15 Trp residue was in a more hydrophobic
environment in Hb S relative to Hb A.
This was true in both the oxy and the deoxy states (FIG
9.3). Since
the b15
Trp residue is close to the site of mutation (b6Glu®Val), we attribute the changes observed to that
residue. In terms of the
protein, the different environment for the Trp residue suggested that the
helix that it is located on, the a-helix, is closer to
the interior of the
protein in Hb S relative to Hb A.
FIG
9.2 How does FmetHb S compare to
FmetHb A?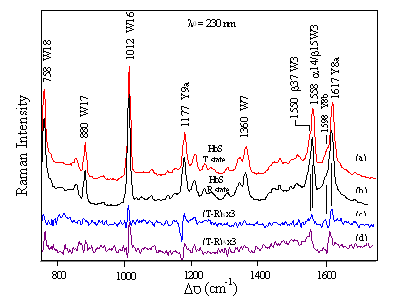
Quaternary state contacts are the same for Hb A and Hb S Intersubunit H-bonds characteristic of the T-state are observed Sokolov and Mukerji, J. Phys, Chem. B (1998) 102, 8314-8319 |
FIG
9.3 How does FmetHb S compare to
FmetHb A?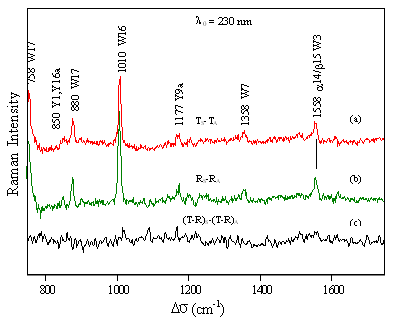 Tertiary Structure differences between Hb A and Hb S -intensity increase of W3 Trp mode at 1558 cm-1 -stronger H-bond between 15/14 Trp residues and 72 Ser and 67 Thr residues on E-helix -displacement of the A-helix present in both quaternary states |
How
do Hb S fibers compare with Hb S tetramers?
FIG
9.4 Quaternary structure of Hb S fibers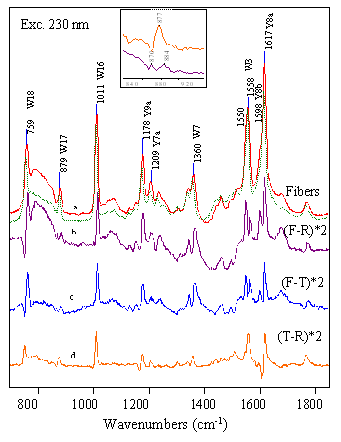 T-state contacts are stronger in fibers -all Trp modes are more intense -Tyr modes exhibit larger shifts |
Our
subsequent UVRR studies with Hb S fibers detected many different changes
in the protein relative to the individual tetramer molecules (link
to pdf of published paper 350
kb).
In terms of the H-bonds that stabilize the T-state, our studies
showed that these bonds are stronger in the fibers than they are in
the individual tetramers (FIG 9.4).
It has been known for a long time that it is harder to get the
fibers to take up oxygen once formed; thus, our finding provides a
physical basis for this observation. |
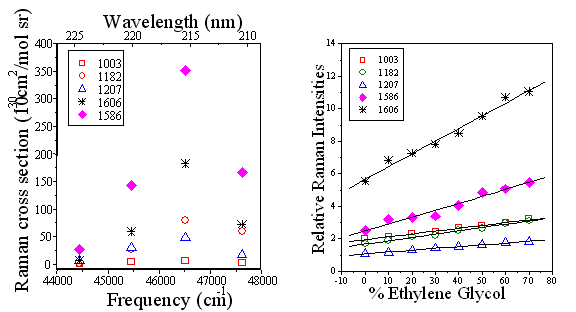
The UVRR studies also showed an increase in Phe signal intensity (FIG 9.5). This increase is consistent with an increase in hydrophobicity of the Phe local environment (FIG 9.6).
|
FIG
9.5 Phe residues probed
with 215 nm |
| FIG
9.6 Effect of local
environment on Phe residues
*Phe
residues maximally enhanced using 215 nm excitation |
| FIG 9.7 UV Resonance Raman Spectrometer |
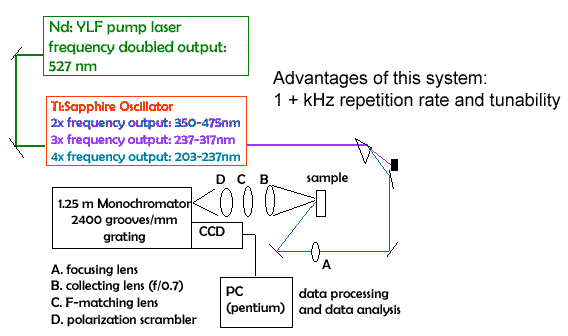 |
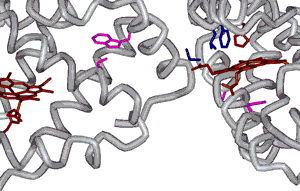
| We have assigned this signal to the b85 Phe residue that is in the hydrophobic pocket, which interacts with the b6 mutated residue of a different tetramer (FIG 9.7). This is one of only two Phe residues in the protein that experiences a different environment as a consequence of fiber formation. |
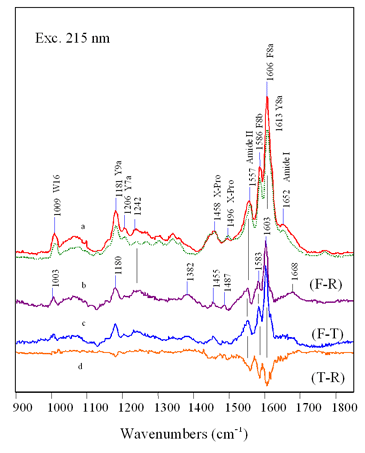
FIG
9.8 Probing
secondary structure conformation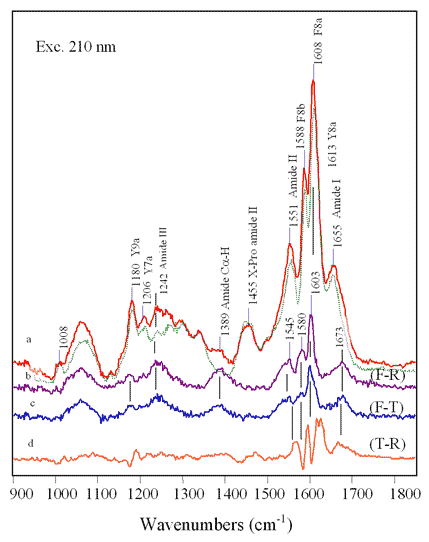 (F-R) and (F-T) difference spectra - Amide I and III frequencies indicate increase in random or unordered structure - Intensity increase of Amide II and C-H indicates loss in helical structure |
Other
structural changes observed:
·
Decrease
in a-helical
content (FIG 9.8) and an increase in random coil structure.
The protein could be unfolding to make a better contact in the
donor-acceptor interaction.
·
b25
Pro residue next to the mutated b26 Val residue experiences a weakening in H-bond
interaction in the fibers. This
weakening is consistent with a reduction in a-helical structure of the N-terminus and general
plasticity of the donor-acceptor interaction.
·
Trp
residues are heterogeneous in terms of their local environment.
b37 Trp residues at the subunit interface forms
stronger H-bonds (FIG
9.9). b15
Trp residue is in a very hydrophobic environment, consistent with its
proximity to the important 1b1-2b2 interaction
(FIG
9.10).
(What is Raman Spectroscopy?)
(Hb research in the Mukerji Lab)
