
![]()
![]()
![]()
![]()
What is Raman
Spectroscopy?
-Theory
behind it: Rayleigh light scattering
-Raman Effect
-Links
to sites on spectroscopy
-Raman
Resonance Spectroscopy
-Going Deeper:
Molecular Vibrations
Raman spectroscopy utilizes light
scattering to gain information about a molecule’s vibrations. (link
to going deeper: Molecular
vibrations) These
vibrations can then provide information regarding the structure and
symmetry of the molecule. In
the case of Hb, these vibrations yield information regarding local
environment and H-bonding. The
vibrations are inferred from the frequency of the scattered light.
When light is incident on a molecule, it can interact with the
molecule but the net exchange of energy is zero, so that the frequency of
the scattered light is the same as the incident light (n = no).
This process is known as Rayleigh scattering.
Conversely, the light can interact with the molecule and the net
exchange of energy is the energy of one molecular vibration.
If the interaction causes the light photon to gain vibrational
energy from the molecule then the frequency of scattered light will be
higher than that of the incident light (n
= no + Dv),
this process is known as Anti-Stokes Raman scattering. On the other hand if the interaction causes the molecule to
gain energy from the photon then the frequency of the scattered light will
be lower than that of the incident light (n = no
- Dv);
this process is known
as Stokes’ Raman scattering. This
is the type of Raman scattering that is measured in the Mukerji lab.
 |
FIG 8.1
The Raman Effect |
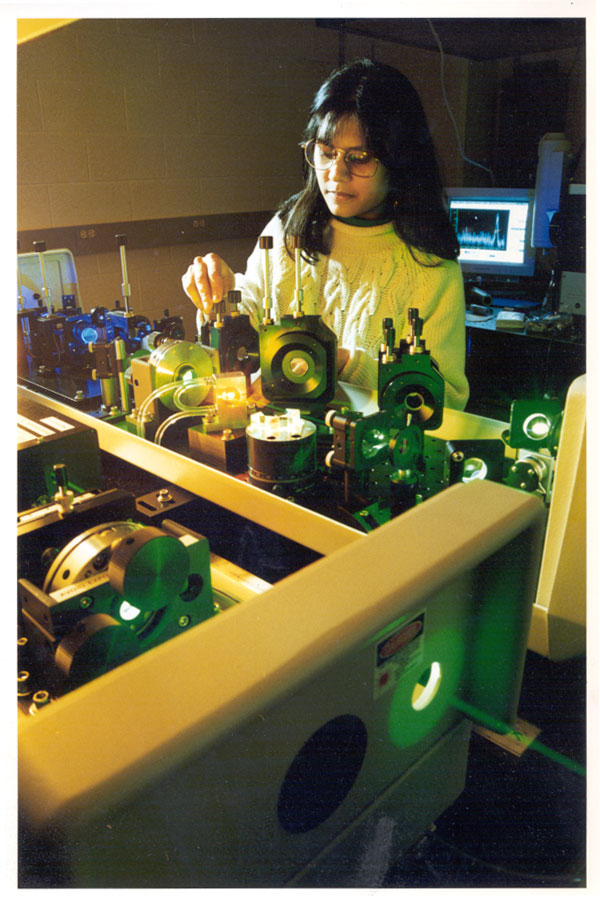 FIG 8.2 The
UV Raman Spectrometer in action
FIG 8.2 The
UV Raman Spectrometer in action
Prof. Mukerji at work with the UV laser system.
Helpful graphic and animated links to understand different spectroscopic
techniques:
UV-Vis Absorption Spectroscopy
http://www.shu.ac.uk/schools/sci/chem/tutorials/molspec/uvvisab1.htm
-clearly explains the UV absorbance of molecules by UV-Vis spectroscopy,
with use of Beer's Law and the and detailed graphics of electronic
transition of absorbing species
Electron Excitation and
Emission
http://microscopy.fsu.edu/primer/java/exciteemit/index.html
-an interactive Java tutorial on the use of radiation to observe electron
excitation and emission.
Jablonski Diagram
http://microscopy.fsu.edu/primer/java/jablonski/index.html
-an interactive Java tutorial on fluorescence, using the Jablonski diagram to
demonstrate absorption of a photon and subsequent emission of a photon
(fluorescence).
What is resonance Raman
spectroscopy?
| In the Mukerji laboratory, we also take advantage of the 'resonance effect.' The Raman signal can be strongly enhanced (at least 3 orders of magnitude) by exciting directly into an absorption band of the molecule. The advantage lies in the fact that by tuning the excitation wavelength, we can now selectively examine different parts of the molecule. In Fig. 8.3, we can see how much difference this can make when obtaining resonance Raman spectra of hemoglobin. If we use an excitation wavelength of 418 nm, this is right in the center of the absorption band for the heme group and therefore the molecular vibrations that are enhanced all arise predominately from the heme group. If an excitation wavelength of 230 nm is used, this primarily enhances the vibrations from tyrosine (Tyr) and tryptophan (Trp) amino acid residues in the protein. | 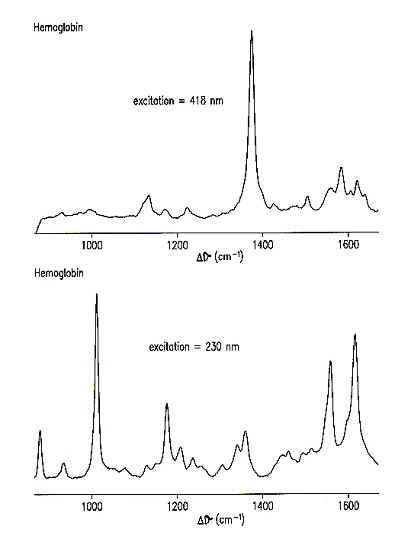 FIG 8.3 Different excitation wavelengths enhance Raman signal from different parts of the molecule 418 nm: Excitation into heme absorption band. RR spectra from the heme 230 nm: Excitation into absorption band of Tyr and Trp. UVRR spectra arises from those residues in the protein
•––
|
The Raman spectrum obtained with 230 nm excitation is completely different from the one obtained with 418 nm excitation because of the resonance enhancement. This gives us a great deal of selectivity in our experiments and by choosing the excitation wavelength we can decide which part of the molecule we want to monitor. For most of our experiments, we examine the protein portion of the molecule. We are particularly interested in tyrosine, tryptophan and phenylalanine amino acid residues. |
|
Going Deeper: Molecular Vibrations
(How do we study fiber formations)
(What did UVRR tell us about Hb A and Hb S tetramers)